Learning how to read stock charts is one of the most important skills for any investor or trader. Charts help you understand price movements, identify trends, and make informed decisions instead of guessing. Whether you are tracking stocks on NSE or BSE, understanding chart basics gives you a clear view of market behaviour.
If you are completely new to the stock market, you may first want to read our Indian stock market basics guide.
What Is a Stock Chart?
A stock chart is a visual representation of a stock’s price movement over a period of time. It shows how prices opened, moved throughout the day, and closed.
- Charts help identify buying and selling opportunities.
- They allow you to study past behaviour and predict future direction.
- Most platforms show daily, weekly, monthly, and intraday charts.
Types of Stock Charts Used in India
Line Chart
- Simple and clean
- Shows closing prices over time
- Good for beginners to understand overall movement
Bar Chart
- Displays open, high, low, and close
- Provides more detail than line charts
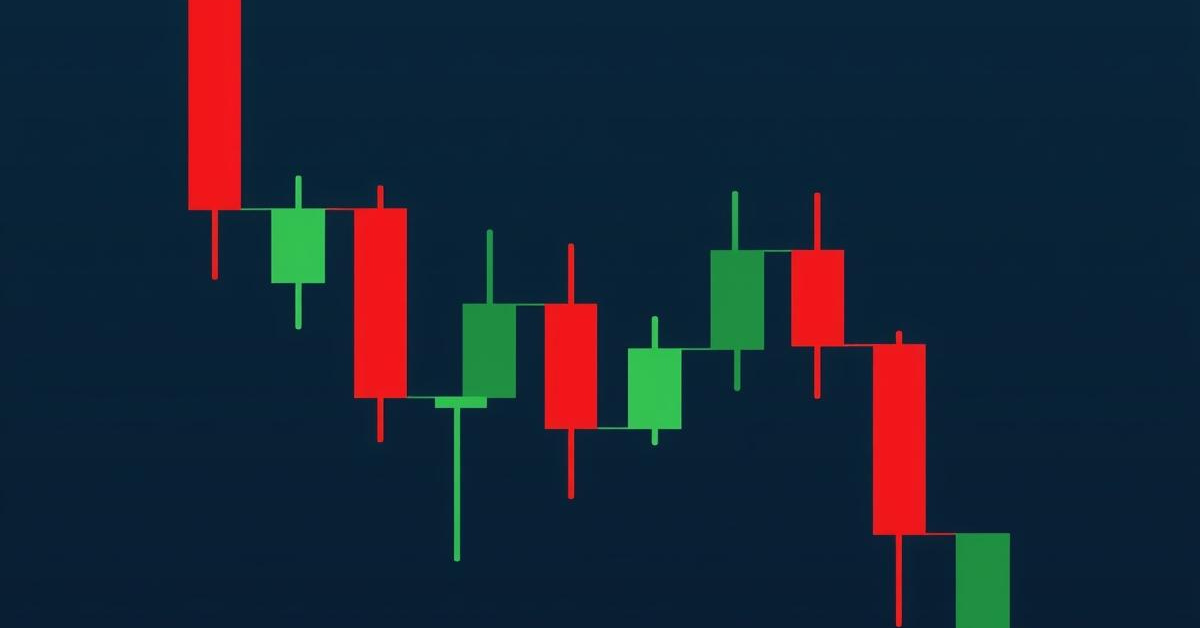
Candlestick Chart (Most Popular)
- Shows price movement clearly using red/green candles
- Helps identify market trends and patterns
- Widely used by traders for analysis
Understanding Candlestick Components
Each candlestick represents price action during a specific period.
1. Open Price
- The price at which the stock trading starts for that session.
2. Close Price
- The price at which trading ends for that session.
3. High Price
- The highest level the stock reached during the session.
4. Low Price
- The lowest level during the session.
5. Body and Wick
- The candle body shows opening and closing prices.
- The wicks (shadows) represent highs and lows.
Types of Candlesticks Beginners Should Know
- Bullish Candle: Close price is higher than open price.
- Bearish Candle: Close price is lower than open price.
- Doji: Market indecision; open and close are nearly the same.
- Hammer: Bullish reversal signal after downtrend.
- Shooting Star: Bearish reversal signal after uptrend.
What Are Stock Market Trends?
Trends show the general direction of the stock price.
Uptrend (Bullish Trend)
- Higher highs and higher lows
- Indicates strong buyer demand
Downtrend (Bearish Trend)
- Lower highs and lower lows
- Sellers dominate the market
Sideways Trend
- Price moves within a tight range
- Market is undecided
How to Identify Trends on Charts
1. Use Trendlines
- Draw lines connecting highs or lows to visualize direction.
2. Check Higher Timeframes
- Weekly and monthly charts give clearer trends than intraday.
3. Look for Higher Highs / Lower Lows
- Patterns reveal whether the trend is rising or falling.
Basics of Volume Analysis
- Volume shows how many shares were traded.
- High volume indicates stronger trend confirmation.
- Low volume suggests weak or temporary movement.
Why Reading Charts Matters
- Helps avoid emotional trading
- Improves entry and exit timing
- Supports long-term investing decisions
- Builds confidence in market analysis
To understand the difference between trading and investing approaches, you may read our guide on trading vs investing differences.
Common Mistakes Beginners Should Avoid
1. Relying Only on One Timeframe
- Always check multiple timeframes before deciding.
2. Ignoring Volume
- Volume confirms the strength of a trend.
3. Overloading Charts With Indicators
- Stick to basic candles and trendlines initially.
4. Trading Without Understanding Patterns
- Study candle patterns before acting on signals.
Final Thoughts
Reading stock charts is a skill that improves with practice. Once you understand candlesticks, trends, and volume, you can interpret market movements with far more clarity. Whether you invest long term or trade actively, chart-reading helps you make disciplined and informed decisions.
SEBI Compliance and Legal Note
This article is for educational purposes only and should not be considered financial advice.
Market data is sourced from publicly available information on SEBI, NSE, and BSE.
For investor complaints, visit the SEBI SCORES platform.
Consult a SEBI-registered financial advisor before making investment decisions.